
Q. What should I be looking at in Google Analytics to get started?
A. Start with the Channels report, to see where your traffic comes from.
The most useful Google Analytics report for most businesses is the Channels report, found in the Acquisition silo under All Traffic. This report is easy to understand and gives you an instant snapshot of which channels give you the most traffic and the most engaged traffic.
In the example below, we looked at New Visitors, interested in discovering how they found the web site for the first time. Organic search was the most prolific channel. Organic means the visitor searched on Google and clicked on a listing on the search engine results page (SERP). We don’t know what the search term was (Google hides that information, but you can see an excellent sample set if you use AdWords paid search). Next best was Direct, which means the visitor typed the URL into the search bar of a browser. For this business, Referral was a strong channel, bringing in visitors from professional and trade association websites through links on those sites. Email refers to email campaigns to bring in prospects and they must have properly tagged links to appear in the Channels report. Social media activity resulting in site visits is also shown, although in this example it has the highest bounce rate. Your social media accounts should be set up under your URL.
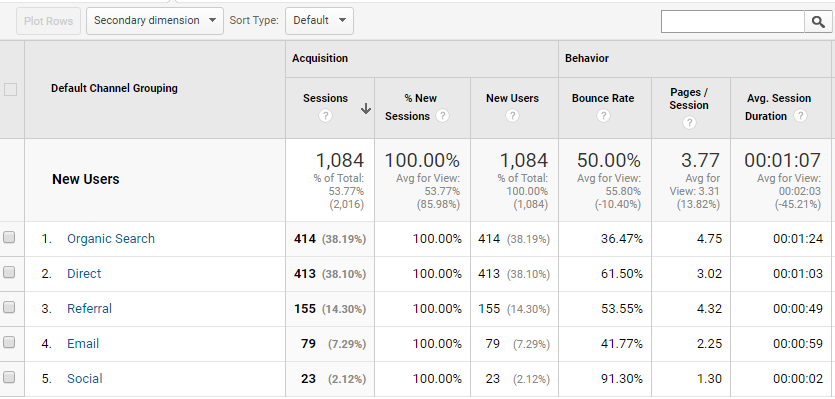
When we look at “Bounce Rate,” we want to verify that a specific channel did not have visitors who jumped off quickly without performing another action on the page or navigating to another page. Note that “Social Media” had over 90 percent of visitors jump right off the page in an average of 2 seconds, which we have found is not unusual. Social traffic is often looking for more entertainment.
The channels report is also valuable for engagement data: “Pages/Session” and “Avg. Session Duration.” Here, we see that Organic Search and Referrals did the best among all the channels. Direct did a mediocre job (often direct traffic is just looking for a specific piece of information like an address or phone number), as did email, and Social was weak.
The Online Grail: Conversions
The Channels report also contains important information about which channels are most effective in conversions, the most important action site owners want to track. Conversions information appears all the way to the right in the Channels report:
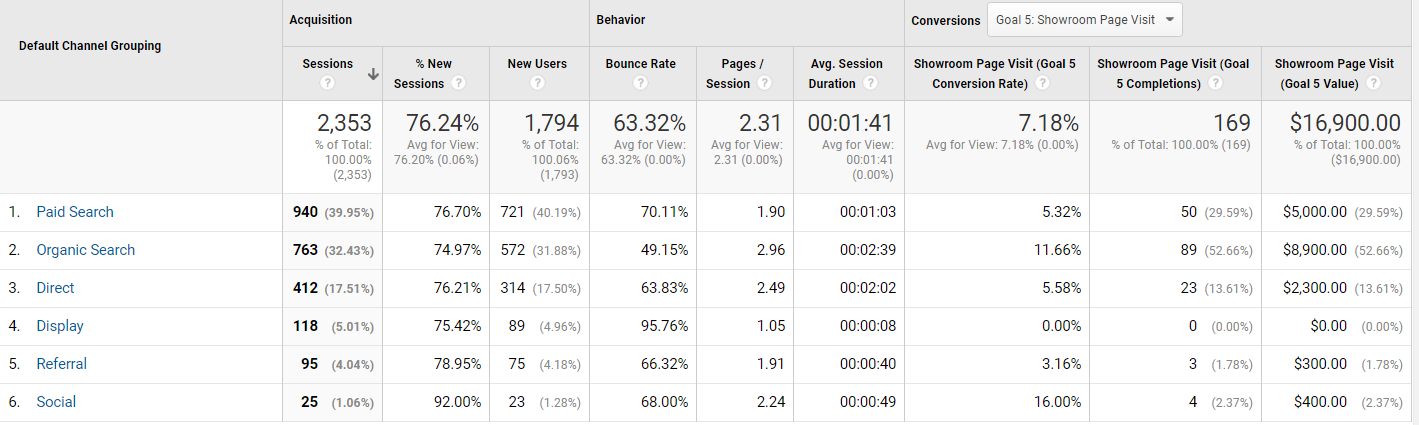
In this example, the website is for a home furnishings company that sells to wholesalers and also uses paid search and display advertising to bring visitors to the site. Let’s look closely at the nature of this conversion and which channels perform the best at it
For this client, the company is calling a visit to the showroom page a conversion. This is a good example of knowing the customer and the business, and showing flexibility. Most business will call filling out a customer request form or clicking on the “Call us now!” button a conversion (which this company did, also). But in this case, the company knows that visiting the showroom page indicates a desire to find a solution, an actual predisposition to purchase, and they called that a conversion. Smart.
Here, Organic Search, Paid Search and Direct had the most conversions, with Organic doing best by far. Paid Search did least well by conventional engagement standards, though that is to be expected given that the visitor probably came straight to the content they were looking for and did not click around. This example certainly shows the value of Organic Search because of the high engagement and high conversion rate. The marketing director would probably conclude from this report that Paid Search is certainly worthwhile, and realize the investment in site optimization is still paying off, month after month.
[NOTE: Referral and Social suffer from the “low base” problem – there were simply not enough visitors to draw any conclusions about their conversions.]
There is a hidden issue: how to monetize a conversion properly. Sorry, folks, you have to do the math. This company simply put a $100 value on every conversion, including ones not seen on this page. Click on a response mechanism, sign up for the email blast, visit the showroom page; everything was valued at $100. But are they really equivalent in terms of the dollar value sales that result? Understanding how they differ by actually measuring prospect behavior will make the Channel report that much valuable, because it will result in an optimized marketing spend based on which efforts result in the strongest sales.
It is important to realize there is never just one “touch” before the sale, there are often several. By taking a more sophisticated view of how many “touches” (and which touches) a prospect needs before becoming a customer, you can better justify the cost/sale of other marketing initiatives like white papers, social media marketing, PR, email, SEO or paid search…and this knowledge helps you determine how high you can bid, or which terms have the best ROI. Given enough data, you may refine your keyword strategy to focus on high-converting terms.
Engagement: using your data to improve the performance of other pages on the site
There is an opportunity to reverse-engineer your site content by looking at which pages have the best “time spent” numbers, then analyzing what might be different about that page: Does it have longer copy? Several bulleted lists? Is copy ‘hidden’ behind call-outs or drop-downs, things that allow the visitor to find precisely what they are looking for quickly but with great detail? If your website has certain pages that have unique copy and design features and also have better engagement, obviously you want to capture that strategy and propagate it to more pages. On the other hand, if people visit a page and immediately leave, it doesn’t have compelling content…and you may have lost a sale. These pages need to be improved.
Google has always given better search rankings to websites that work for the visitor, not the publisher. One thing that has changed recently is how Google determines which page works for the visitor under specific circumstances, namely on mobile devices. Google constantly tinkers with their search algorithms with this question in mind: which website has the best information to answer a given query, the most information, the most complete information? Too many websites have a pleasant design but very few words on the pages – and that hurts their search rankings. Google tracks engagement metrics to see if the visitor found the page which answered the query, or if they became frustrated and left. So if you take a long, hard look at your engagement numbers on a per-page basis (found in the Behavior section) and see which pages are successful in engaging your visitors, you will have the “secret sauce” – a template for further engagement and a more successful website.